
Rank your app in the TOP for any keyword, in any geo
We climb your app to the top of App Store & Google Play search and take over the organic traffic — the installs that ads would bill you for every month, owned once.
1. Paste your link · 2. Pick your geo · 3. Get your top-30 keywords, ranks & our price
Trusted by app publishers, mobile marketers and growth leads across every industry — crypto, fintech, e-commerce, gaming, wellness, travel and more.
Get your ASO growth proposal — in one minute
Tell us your app, up to 3 markets and your email. We build a personalized PDF proposal — the paid-media value of a top-3 ranking and exactly what it costs to get there — and email it straight to you.
Free · no obligation · we email your proposal and follow up personally.
Two ways to win in the stores
Start free with the analytics — and when you're ready, we get you to the top, done-for-you.
ASO analytics platform
See your live ranks, top-30 keywords, and what top-3 is worth in real installs — any app, any geo. Self-serve, from free.
- Live rankings
- Top-30 keywords
- Top-3 installs value
Done-for-you: get to top-3
We rank your app into the top-3 for your chosen keywords. Price per keyword, geo and platform — shown in your free report. Metadata prep included free.
- Top-3 rankings
- Custom strategy
- Free metadata prep
Your best users are searching the store right now — and finding your competitors
Paid ads rent every install and cost more each quarter. The highest-intent users — the ones typing exactly what your app does into store search — never see you, because you're not ranking. We fix that at the source.
Paid CPI keeps rising
ASA, Google Ads and SMM installs get more expensive every quarter.
Paid traffic churns
Ad-driven users retain worse than users who searched for you on purpose.
You're invisible in search
If you're not top 1–5, high-intent installs go to whoever is.
What the top of search is worth
Top keyword in 7 of the biggest US app categories — real Google Keyword Planner demand. Organic installs at the top, the paid-ads cost of the same installs, and our price.
| Industry & top US keyword | Searches / mo | Installs / mo top 1–3 |
Paid ads / mo top 1–3 | AppsLift top-3 + support | You save year 1 |
|---|---|---|---|---|---|
| Finance & Banking"budgeting app" | 135,000 | 14k–38k | $109,091–$290,910/mo | $76,607one-time+$15,321/mo | $3,230,461≈93% less |
| Crypto"crypto" | 201,000 | 21k–56k | $138,252–$368,672/mo | $97,084one-time+$19,417/mo | $4,093,976≈93% less |
| Mobile Games"online games" | 550,000 | 58k–154k | $35,760–$95,360/mo | $25,112one-time+$5,022/mo | $1,058,944≈93% less |
| Sports Betting"betting" | 165,000 | 17k–46k | $356,956–$951,883/mo | $250,663one-time+$50,133/mo | $10,570,337≈93% less |
| Health & Fitness"fitness app" | 27,100 | 3k–8k | $11,285–$30,093/mo | $7,924one-time+$1,585/mo | $334,172≈93% less |
| Dating"dating app" | 201,000 | 21k–56k | $121,831–$324,883/mo | $85,552one-time+$17,110/mo | $3,607,724≈93% less |
| Travel"cheap flights" | 3,350,000 | 352k–938k | $482,508–$1,286,687/mo | $338,828one-time+$67,766/mo | $14,288,224≈93% less |
| 7 keywords | $1,255,683–$3,348,487/mo | $881,770+$176,354/mo | $37,183,838 |
Same installs, same top rankings — up to ~90% less than paying for them with ads.
Installs = US search demand × top-position capture (28% / 16.8% / 10.5% at #1 / #2 / #3). Paid-ads cost = those installs × real US CPI from advertiser bids. Full methodology — iOS & Android breakdown →
Want it done for you — for a fraction of what those installs cost in ads? Order promotion → or talk to us on Telegram
Not ads. Real organic ranking.
Any keyword, any geo
We build a full semantic core and rank you where your users actually search.
Pure organic installs
Higher retention and LTV than paid traffic — users who found you, not chased you.
Up to 90% budget saved
ASO scales without paying per click. Your cost per install keeps dropping.
From link to the TOP — in four steps
Audit & app research
We map your visibility, competitors and geo — and the ranking opportunity. Free.
Semantic core + keywords
A full semantic core — every high-intent keyword worth ranking for, prioritized by installs.
Metadata update
Title, subtitle, keyword field and description, rewritten to rank.
Push to the top
We push your rankings up and hold position — organic installs compound.
Real apps. Real geos. Top rankings in weeks.
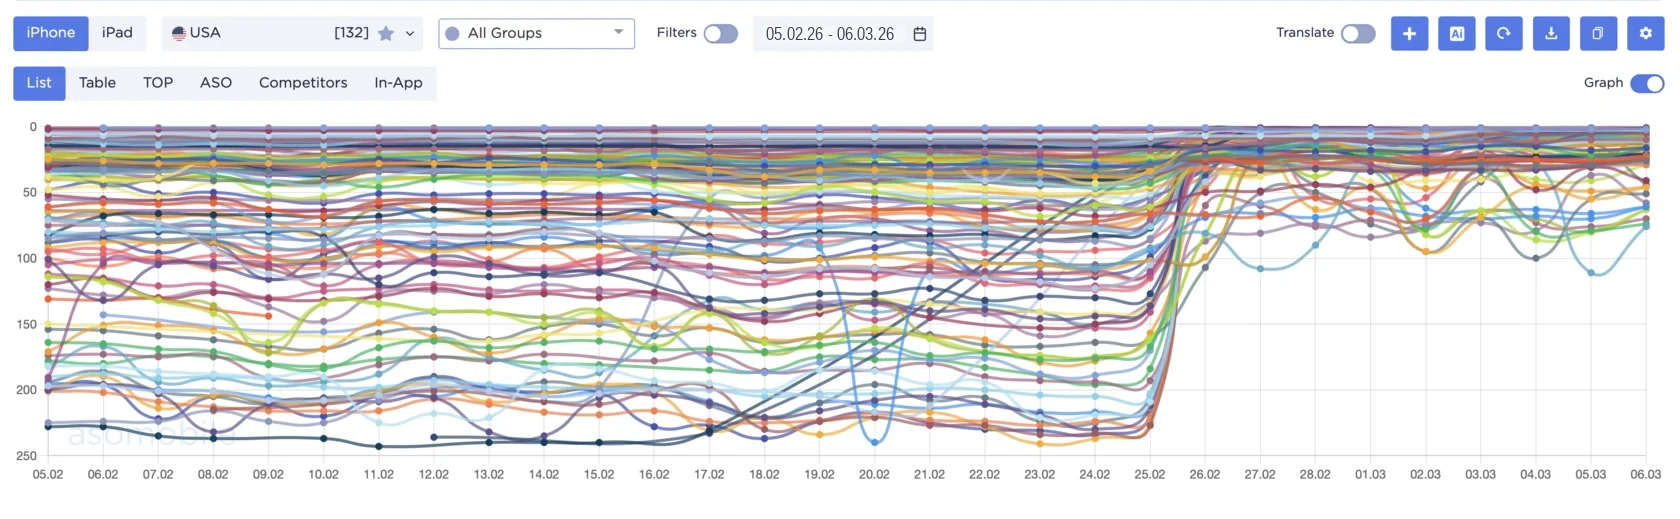
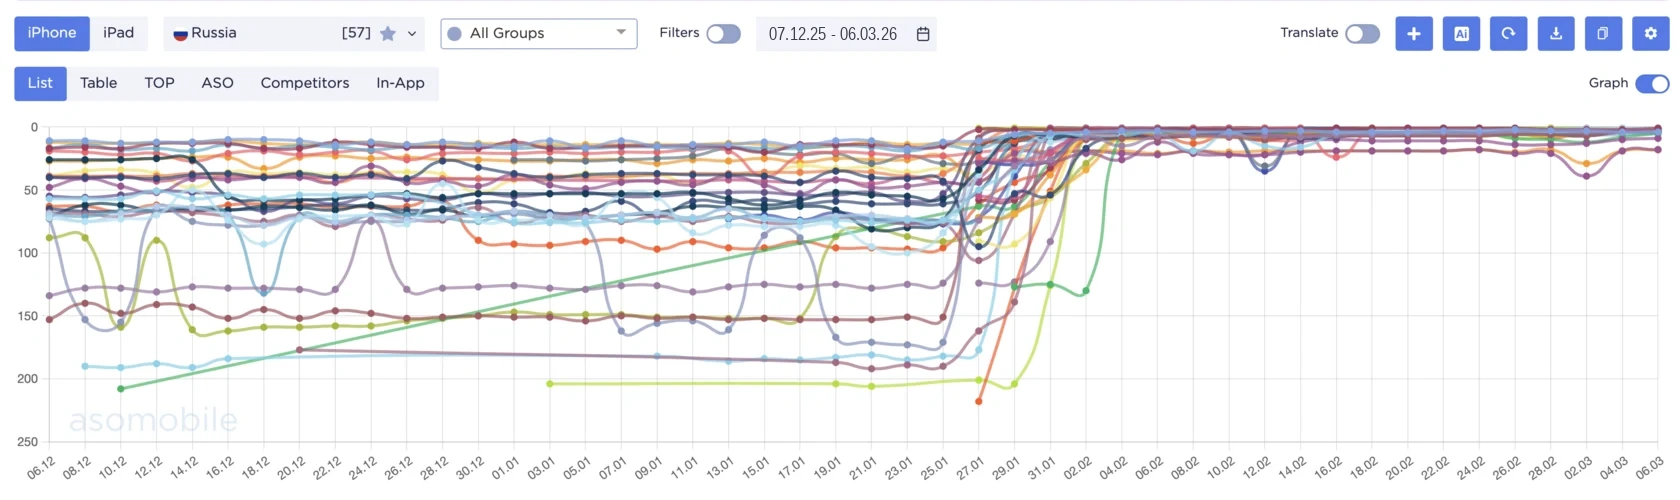
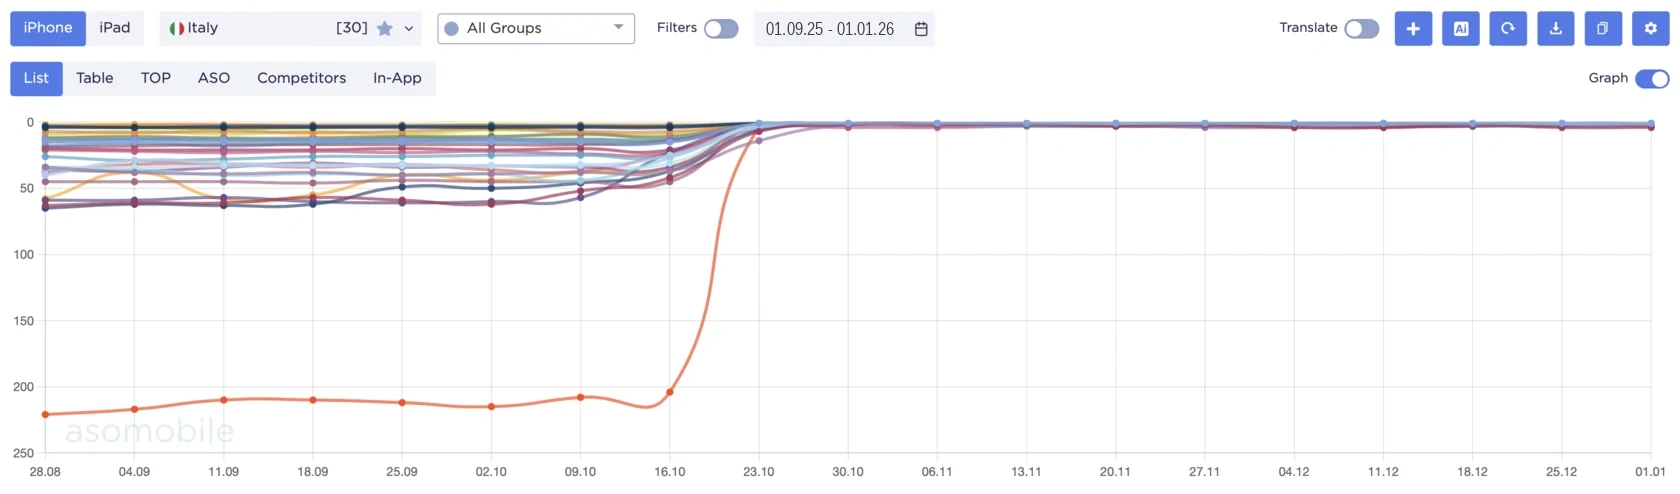
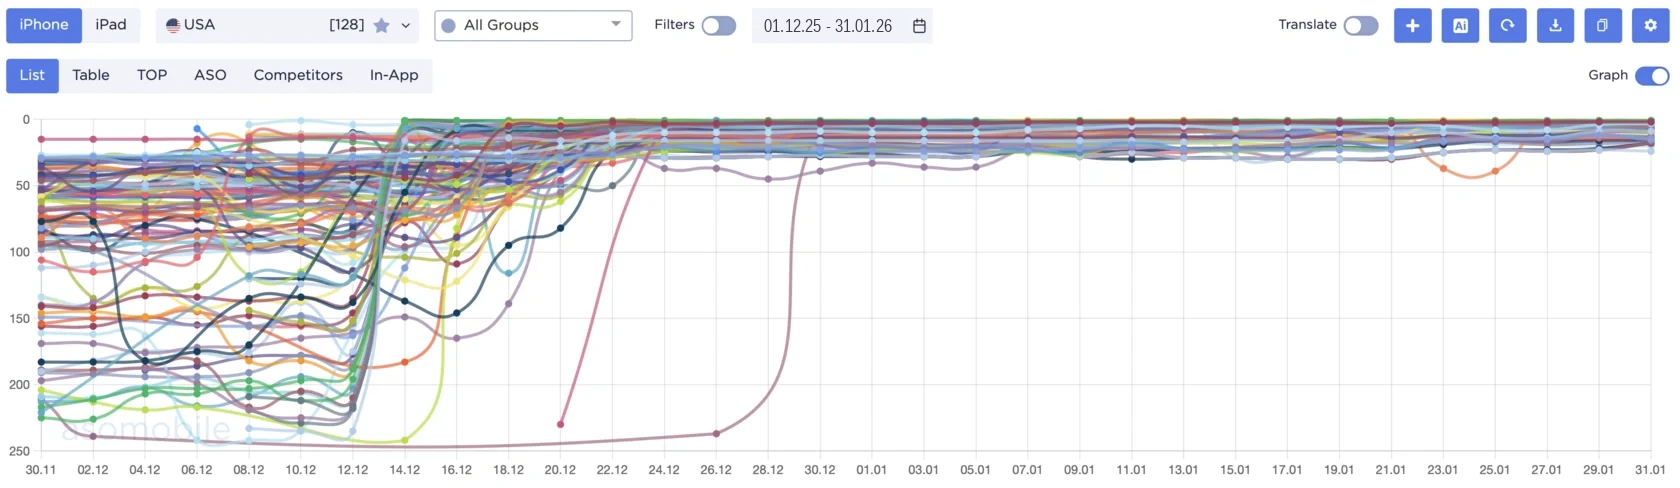
Real keyword-ranking charts, across categories and markets:
Top 1–5 for 100+ keywords in one month.
Top 1–5 for 50+ keywords in a competitive category.
Top 1–3 for 30 keywords in its local market.
Top 1–3 for 70+ keywords — store search as a core channel.
What growth teams say about working with us
It went from a line item we ignored to our biggest organic channel.
They told us what was realistic, then delivered it. No vanity metrics.
Clear KPIs, weekly reporting, and rankings that actually moved installs. No fluff.
Roles and categories anonymized at clients' request.
Every week you wait, a competitor takes your organic installs
Right now someone else is ranking for your keywords — and pocketing the free installs you're paying ads for. Search rankings compound: the earlier you start, the harder you are to catch.
Built for teams that live and die by CAC
If paid installs eat your margin, ASO is your compounding, organic install engine.
Straight answers before you spend a dollar
A one-time fee to rank you in the top 3, plus a small monthly support retainer. You see exact numbers for your app in the free report.
Typically 4–12 weeks, depending on your app's stage, the geo, and keyword difficulty. Your free audit includes a realistic timeline for your specific app and market.
Ads bill you for every install and stop the moment your budget does. ASO gets you the same installs organically — for a fraction of the paid cost — and those rankings keep delivering after the work is done. Most clients redirect the saved budget straight into growth.
We've ranked 1000+ apps across every industry in 60+ geos since 2012. Paste your app link into our analyzer and you'll see exactly what's achievable — free, before you commit.
We rank apps through a structured process — audit, semantic core, metadata, reach — not tricks. It's built on how the stores actually rank apps, so results hold.
Both — App Store and Google Play, in any geo and any category.
Pricing is scoped to your keyword set and geo — typically a fraction of what the same installs would cost through paid ads (see the table above). You get exact numbers for your app in the free audit.
Just your app link, target geo and a way to reach you. We handle the audit, semantic core, metadata and ranking push.
Still have questions?
Leave your contact and we'll get back to you — anything about ranking your app in the top, pricing, or where to start.
We've got it.
We'll get back to you within 1 business day. Meanwhile, message us on Telegram for a faster reply.